Setting Up Alerts in Grafana Using Prometheus for Docker Container Monitoring
Day 78: Grafana Alerting
Introduction
Grafana is a powerful open-source platform for monitoring and observability, allowing you to visualize and analyze your metrics data. One of its key features is the ability to set up alerts based on your metrics data. In this tutorial, we'll guide you through the process of setting up alerting in Grafana using Prometheus as the data source. Specifically, we'll create an alert that triggers when the number of Docker containers is greater than 0.
Prerequisites
Before you begin, make sure you have the following components set up:
Prometheus: Ensure that Prometheus is installed and configured to scrape Docker metrics. Prometheus will act as the data source for Grafana.
Grafana: Install Grafana on your system and configure Prometheus as a data source. This is usually done by specifying Prometheus URL in Grafana's data source settings.
Step 1: Accessing Grafana Dashboard
Open your web browser and navigate to your Grafana instance.
Log in to Grafana using your credentials.
Step 2: Adding Prometheus Data Source
In the Grafana dashboard, click on the gear icon on the left sidebar to open the "Settings" menu.
Select "Data Sources" and click on the "Add your first data source" button.
Choose Prometheus from the list of available data sources.
Configure the Prometheus data source by providing the URL and any required authentication details.
Click "Save & Test" to verify the connection to Prometheus.
Step 3: Creating a Docker Containers Panel
Return to the Grafana dashboard and click the "+" icon on the left sidebar to add a new panel.
Choose Prometheus as the data source.
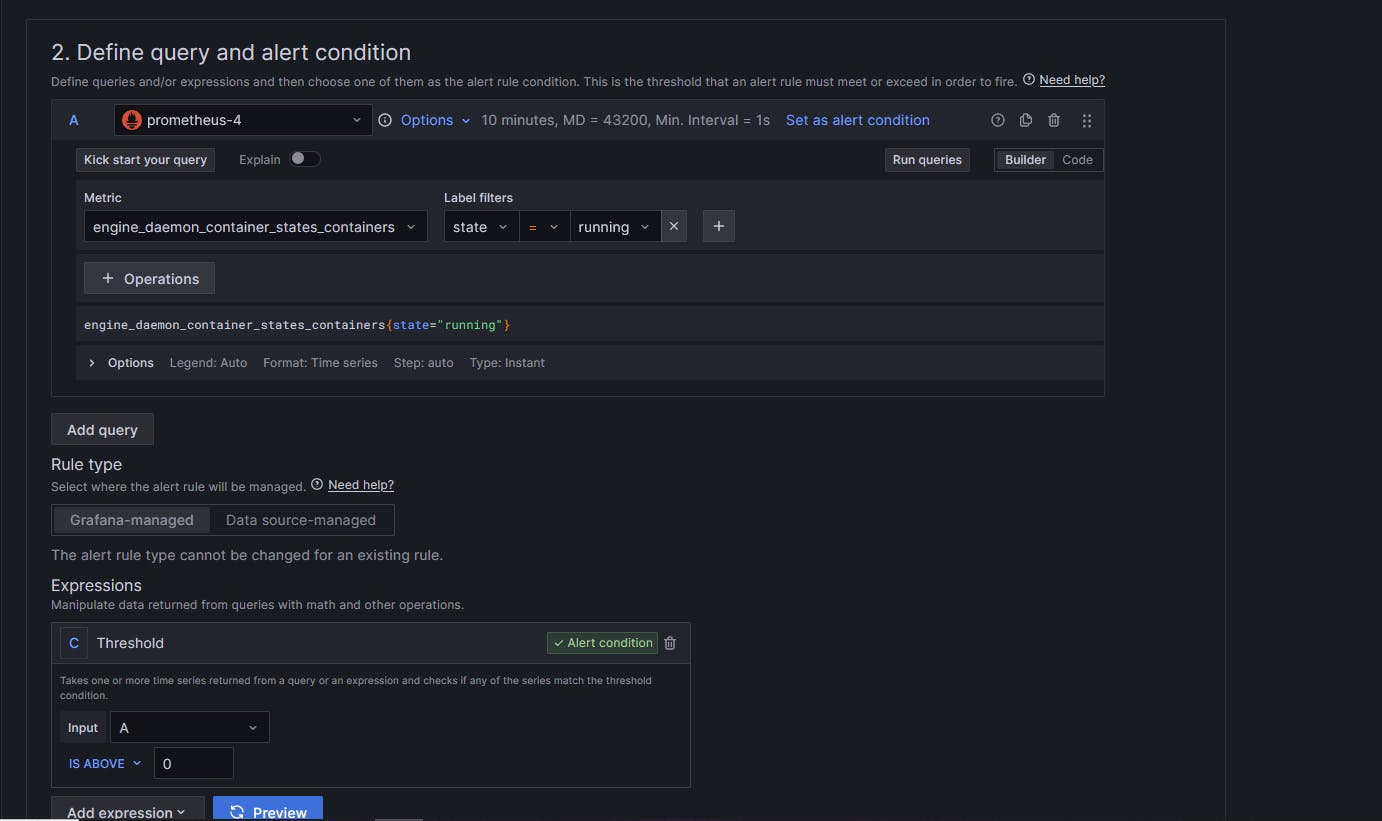
Write a PromQL query to retrieve the number of Docker containers. For example, the query could be:
engine_daemon_container_states_containers{state="running"}Customize the panel as needed, adjusting visualization options and labels.
Save the panel by clicking "Apply" or "Save Dashboard" at the top.
Step 4: Setting Up Alerts
With the Docker Containers panel selected, click on the panel title and choose "Edit."
In the panel editor, navigate to the "Alert" tab.
Click on "Create Alert."
Configure the conditions for the alert. In this case, set the condition to trigger when the "Value is greater than 0."
Specify the alert details, such as the name, message, and severity.
Set up notification channels (e.g., email, Slack, etc.) in the "Notifications" tab.
Click "Apply" or "Save Dashboard" to save the changes.

Step 5: Testing the Alert
To test the alert, intentionally create a situation where the number of Docker containers is greater than 0. This could involve starting a Docker container:
sudo docker run -d --name test_container alpine sleep 300Monitor the Grafana dashboard for the alert status.
Verify that notifications are sent to the configured channels.

Conclusion
Congratulations! You have successfully set up alerting in Grafana based on Docker container metrics from Prometheus. This ensures that you are promptly notified whenever the number of Docker containers exceeds the defined threshold. With this setup, you can proactively manage and monitor your Docker environments, ensuring optimal performance and quick response to potential issues.
Happy Learning!
Follow me on LinkedIn.
